Guillermo Pineda / Profile
- Information
- 5+ yearsexperience8products19demo versions5jobs0signals0subscribers
I'm actively expanding into quantitative trading and machine learning applications to optimize financial strategies.
If you have a project in mind or an idea to discuss, feel free to reach out and connect with me!
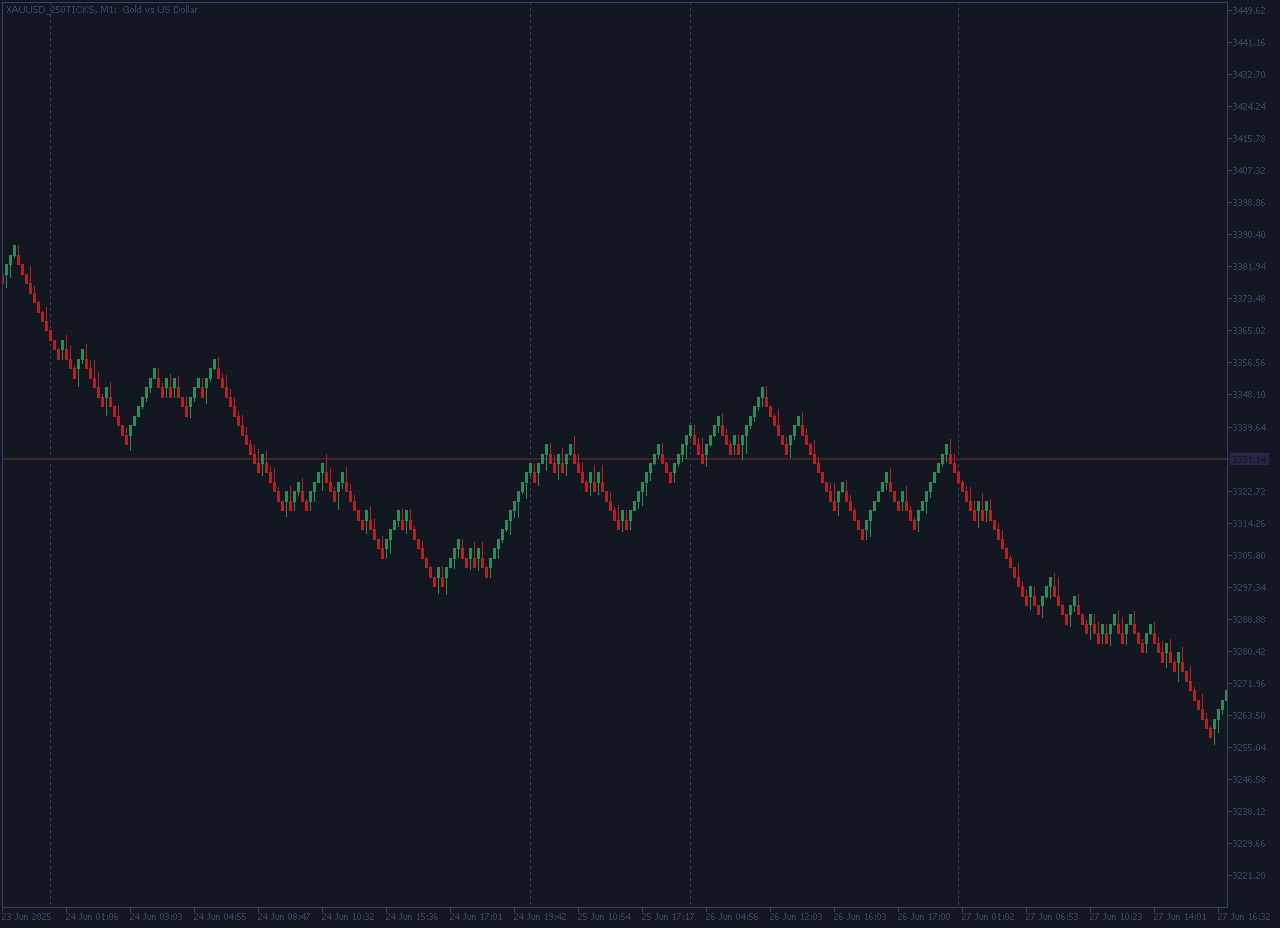
Should I post this Renko Chart creation EA?

Universal Volatility Compass (UVC): Navigate Market Cycles with Confidence Across All Assets Since its introduction in 1993, the CBOE Volatility Index (VIX) has become the go-to measure for market risk and investor fear in the stock market. High VIX readings signal heightened volatility and often coincide with market bottoms, while low readings suggest complacency and market tops. But what about the vast universe beyond the S&P 500, Nasdaq, and Dow? Commodities, forex, cryptocurrencies
| Specification quality | 5.0 | |
| Result check quality | 5.0 | |
| Availability and communication skills | 5.0 |
VWAP Machine Learning Bands: The Predictive Edge for Traders Unlock the next level of market analysis with VWAP Machine Learning Bands – an innovative MQL5 indicator engineered to provide unparalleled insights into market trends, dynamic support/resistance, and high-probability trade signals. Leveraging a proprietary adaptive machine learning algorithm integrated with the power of Volume Weighted Average Price (VWAP), this indicator transcends traditional analysis. It's designed to give you a
| Specification quality | 5.0 | |
| Result check quality | 5.0 | |
| Availability and communication skills | 5.0 |
| Specification quality | 5.0 | |
| Result check quality | 5.0 | |
| Availability and communication skills | 5.0 |
| Specification quality | 5.0 | |
| Result check quality | 5.0 | |
| Availability and communication skills | 5.0 |
Trend Correlation Strength (TCS) Indicator: Your Edge in Forex Trend Analysis The Trend Correlation Strength (TCS) Indicator is a cutting-edge tool that redefines how you measure trend strength, offering a significant advantage over conventional indicators like the Average Directional Index (ADX). Unlike ADX, which relies on directional movement, TCS uniquely quantifies trend strength by calculating the correlation between closing prices and a linear time series . This innovative approach
ALL MOVING AVERAGES: The Ultimate Custom Indicator for Diverse Strategies The ALL MOVING AVERAGES custom indicator is your essential tool for in-depth technical analysis, boasting an impressive collection of over 31 of the most popular moving averages . Designed for both seasoned traders and beginners, this indicator offers unparalleled flexibility, allowing you to perfectly tailor your moving averages to a wide array of trading strategies. With a comprehensive range of input parameters
Trend Entries Histogram: Pinpoint Reversals & Optimize Your Entries The Trend Entries Histogram is a powerful alarm indicator designed to help you detect the end of a trend or price move's lifecycle and anticipate reversals . It provides timely warnings when the market structure is undergoing a significant change, often preceding a major reversal or downturn. This indicator meticulously monitors for breakouts and shifts in price momentum whenever a new high or low is formed around a
Trading Sessions 3: Visualize Global Market Activity Trading Sessions 3 is an intuitive indicator designed to clearly display the key intra-day trading sessions: Asia, London, and New York . Gain a clear understanding of global market activity and pinpoint periods of increased volatility for strategic trading decisions. Key Features: Global Session Visualization: Easily identify the active trading hours for the Asia, London, and New York sessions directly on your charts. Volatility Insights
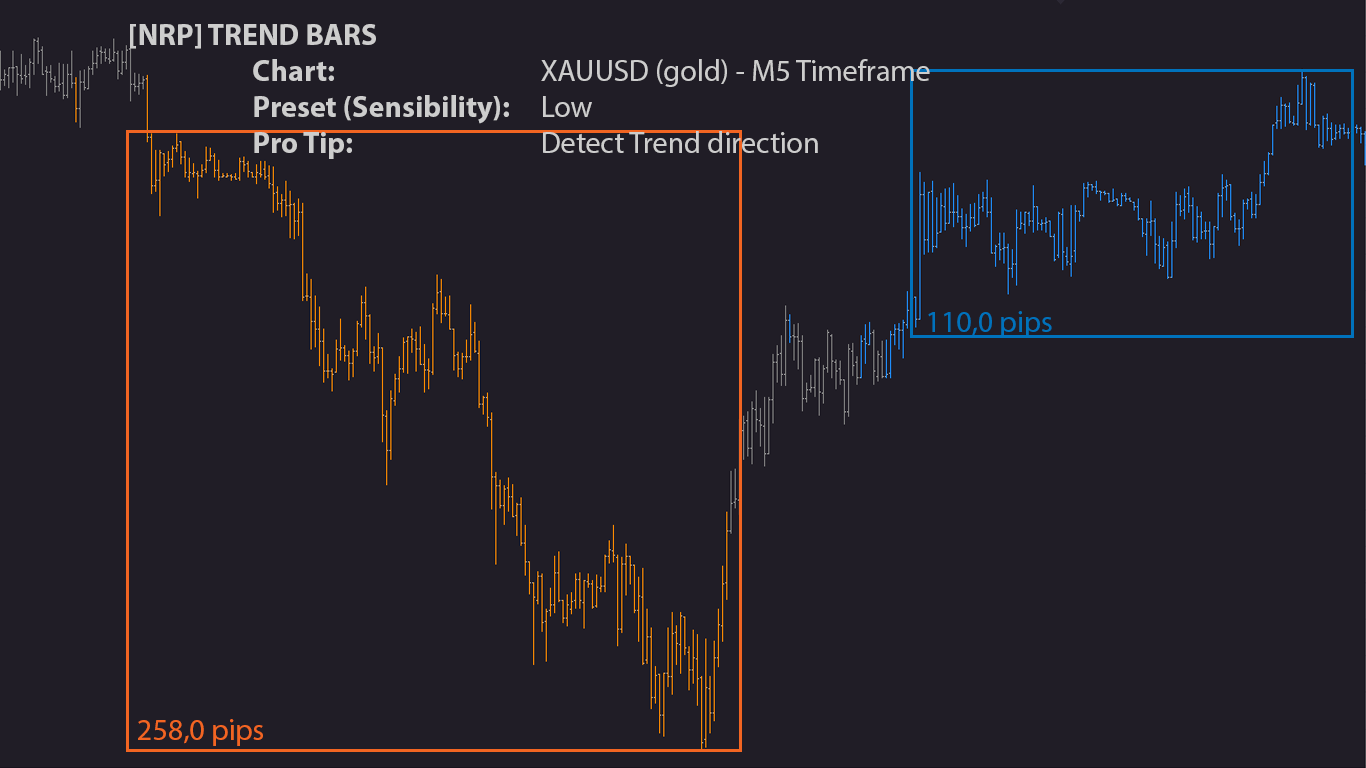
NRP Trend Bars Your all-in-one Trend direction indicator, with Presets and Customisable options ! Get the most of Trends with NRP (No-repaint indicator) Trend Bars , designed to get the best of Trend Entries , Continuations and Reversals One of it's function is the detection of the new trend starting , consolidation and possible trend change . It gives you the opportunity either to get in-&-out of the market in time PRESETS (Sensibility) LOW
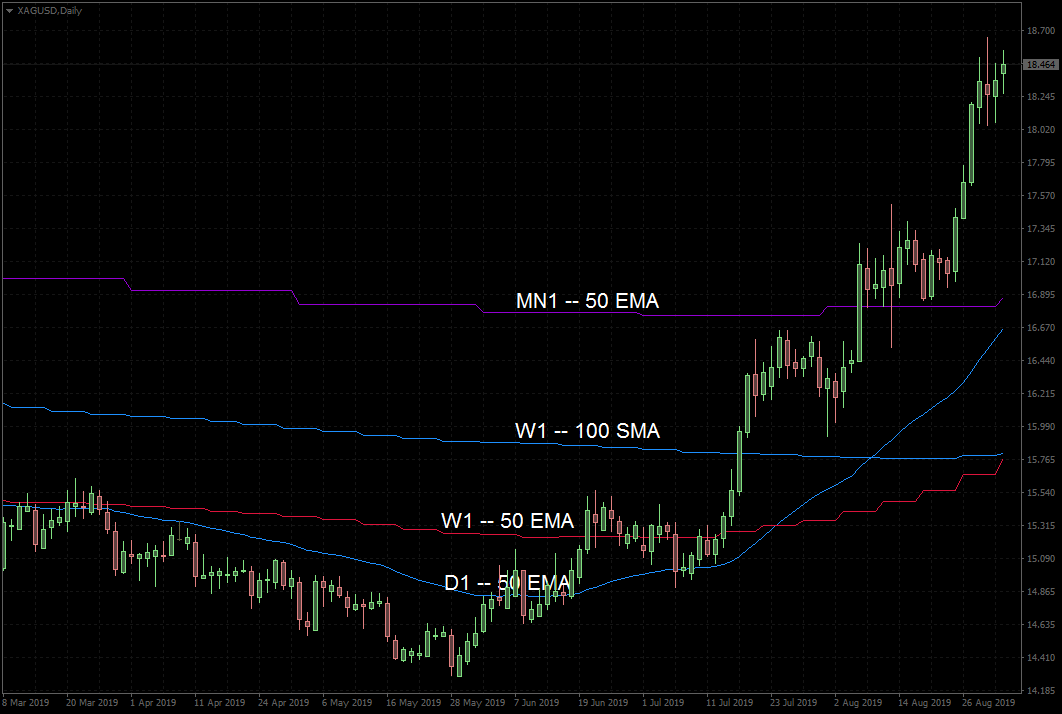
MTF Moving Averages is an useful indicator that brings you data from fully customizable higher timeframe Moving Averages on your charts, you can add multiple Moving Averages to use even more data of current market conditions. Check the indicator in action [Images below] What MTF Moving Averages does apart from showing higher timeframe MA's? Time saver , having all your higher timeframe MA's in just one chart, time is key, avoid switching between timeframes. Enter Trends precisely, easy to follow


